Excel has several built-in forecasting features that can be excellent tools for planning and strategizing. The feature we are going to examine today is called Goal Seek. Goal Seek allows you to work with related figures and determine how much one value would need to change in order for another to meet a goal.
In other words, if you know what number you would like to attain in one cell, but don’t know what input value is needed in a related cell to reach that number, this is the tool for you. Let’s take a look.
Exercise File
If you would like to follow along, here is the exercise file: GoalSeekExercise
Scenario
What are we looking at here? These are recruitment numbers for some fictional colleges on campus. FY19 enrollment headcount is in column B, and you would like to calculate goal enrollment for FY20 in column C.
Column C contains formulas that will calculate an increase in percent based on what you input into cell F1. Go ahead and test it out. What happens To column C if you type 5 into F1?
So an increase of 5% would mean all enrollment figures would increase as shown.
Goal Seek
That formula is nice, but your real hope is to Goal Seek. You would like to figure out how large of a percent increase would be required to raise total enrollment (C6) to 3000.
- Select Cell C6 by clicking on it.
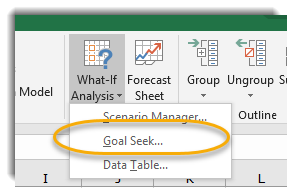
- Go to the Data tab, Forecast group, and select What If Analysis.

- Select Goal Seek

- In the pop screen that appears:

- Set Cell should already read C6, since that was the selected cell.
- To Value: this is our enrollment goal, which was 3000, so change that to 3000.
- By Changing Cell: select cell F1 (next to Increase Enrollment By) or type F1 in the space provided.
- Basically, we are saying we want to see what the percent increase would need to be for our goal of 3000 students to be reached.
- Press OK.
Excel should work out our calculation from here…
Interesting! It looks like enrollment will need to increase by 24%. And each college’s appropriate rate is lined out with their needed increases.
One quick note, all these cells are rounding to the next whole number, so figures are not exact (we can’t recruit a percent of a student after all).
- In the pop up that appears either press OK to accept the change, or Cancel to go back to the original numbers.
Thoughts?
Where could you put this to use in your office? Let me know what you think!
Congratulations, Power Users!
Congratulations to our newest Power Users! For the full gallery, and more information about the WSU Microsoft Office Power User Program, please visit: wichita.edu/poweruser


